So many enterprises believe they have a solid grip on their energy data. They have meters, connected building management systems, and they invested in energy monitoring tools. On paper, they have everything needed. But having the data and actually using it are two different things.
When you try to scale across portfolios, automate decision-making, or prove measurable impact, you start seeing just how big the gap is. Studies show that between 60% and 73% of all enterprise data is never used for analytics. That’s a lot of wasted information.
And there’s another problem. Only about 1 in 5 executives fully trust the data they receive, which makes taking data-informed decisions rather hard.
Now, we also add the increasing pressures of sustainability and compliance, and, with frameworks like BACS, ISO 50001, EPC-NR, and the ESG reporting coming into play, many find their data foundations can’t keep up the pace. Solutions exist, but you must choose them carefully.
Enterprises have more energy data than ever — so why is so little of it usable?
In many organizations, we can find a very similar scenario. They have:
- Smart meters and sub-metering systems.
- Building management systems (BMS).
- IoT sensors.
- Utility feeds.
In theory, teams can use all this information to have precise, near real-time insights. So, why doesn’t reality live up to the theory?
One problem is that many teams manage all this complexity manually. A 2021 industry survey found that around 30% of energy professionals rely heavily on Excel spreadsheets to track and analyse energy performance.
If you’ve ever worked with Excel, you know how hard something like that can be to use, especially as you scale, and gather data from hundreds of buildings. Not to mention how slow and prone to error such a process is.
Even when analytics tools exist, adoption remains a challenge. 67% of managers and executives report feeling uncomfortable using data from their analytics tools, often because outputs are hard to interpret or difficult to trust.
Fragmented energy systems are the norm, not the exception
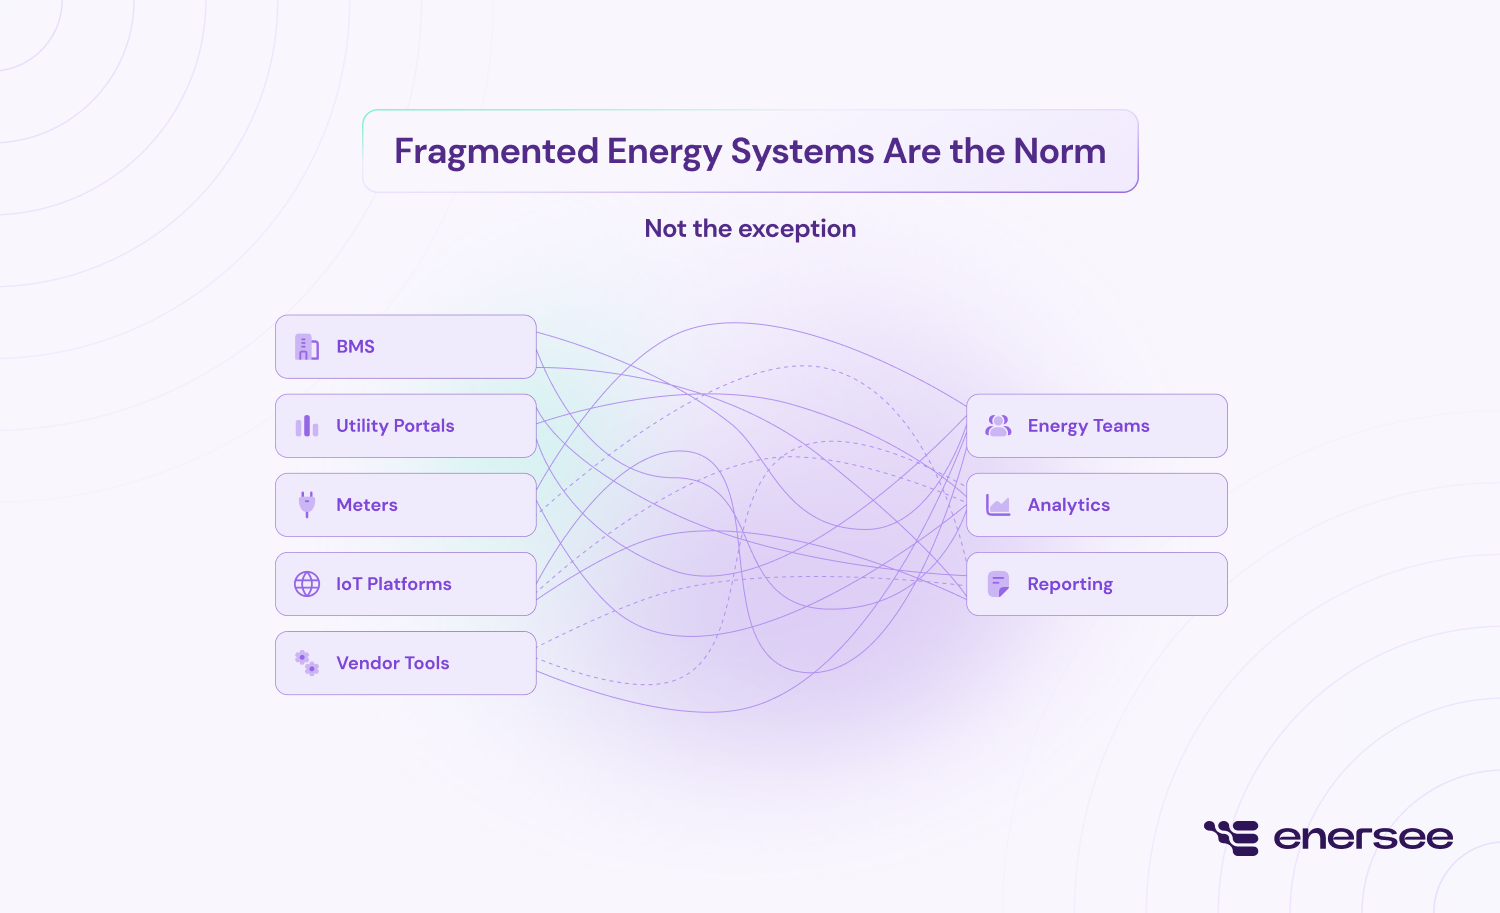
One of the main reasons energy data is hard to use is fragmentation. Enterprises very rarely operate a single, unified system. It’s more common for them to juggle:
- BMS platforms
- Utility portals
- IoT solutions
- Meters and sub-meters
- Vendor-specific energy tools
Each of those comes with its own data model and limitations.
The result can be disastrous. Integrating such different systems is rarely straightforward. Onboarding new sites or data sources can take months of setup and custom engineering, while teams need to find ways to build connectors for systems that have no common standards.
Even companies that invest in energy management software are not immune to these problems. About 15% of organizations report ongoing challenges integrating energy data into their EMS, which goes to show that buying software alone doesn’t solve structural integration problems.
The hidden cost of black-box integrations and poor data quality
Sometimes integrations do exist, but they’re still not enough. That’s because many energy platforms function as black boxes. Data flows in, dashboards appear, but you never understand how they validate, correct, or transform it.
This lack of transparency creates huge quality issues and further deepens the trust issues we previously saw. When you’re missing intervals, notice sudden jumps, or unit mismatches, it’s hard to trust the analysis you’re seeing.
The financial impact is quite large. Gartner estimates that poor data quality costs organizations an average of $12.9 million per year through inefficiencies, rework, and missed opportunities. In energy management, this translates directly into delayed action, disputed savings, and conservative decision-making where inefficiencies are almost never addressed.
Why “real-time energy monitoring” still runs on delayed data
Many organizations claim they’ve figured out real-time energy monitoring. Reality usually contradicts that. Most of their systems operate on batch processing: data arrives hours or days after consumption.
Even when sub-meters and MQTT feeds offer frequent updates, unreliable ingestion and lack of quality checks mean “real-time” data is unusable.
In practice, true real-time monitoring requires:
- Complete data, with no missing intervals.
- Data arriving within clearly defined time thresholds.
- Validated values, not raw or unchecked readings.
And there’s one more thing it needs: systems that can handle gaps, jumps, and meter replacements without overwhelming users. Few organizations have this type of infrastructure in place at the moment, which means they find anomalies only days or weeks after they took place, if ever at all.
Broken energy data undermines AI, analytics, and compliance
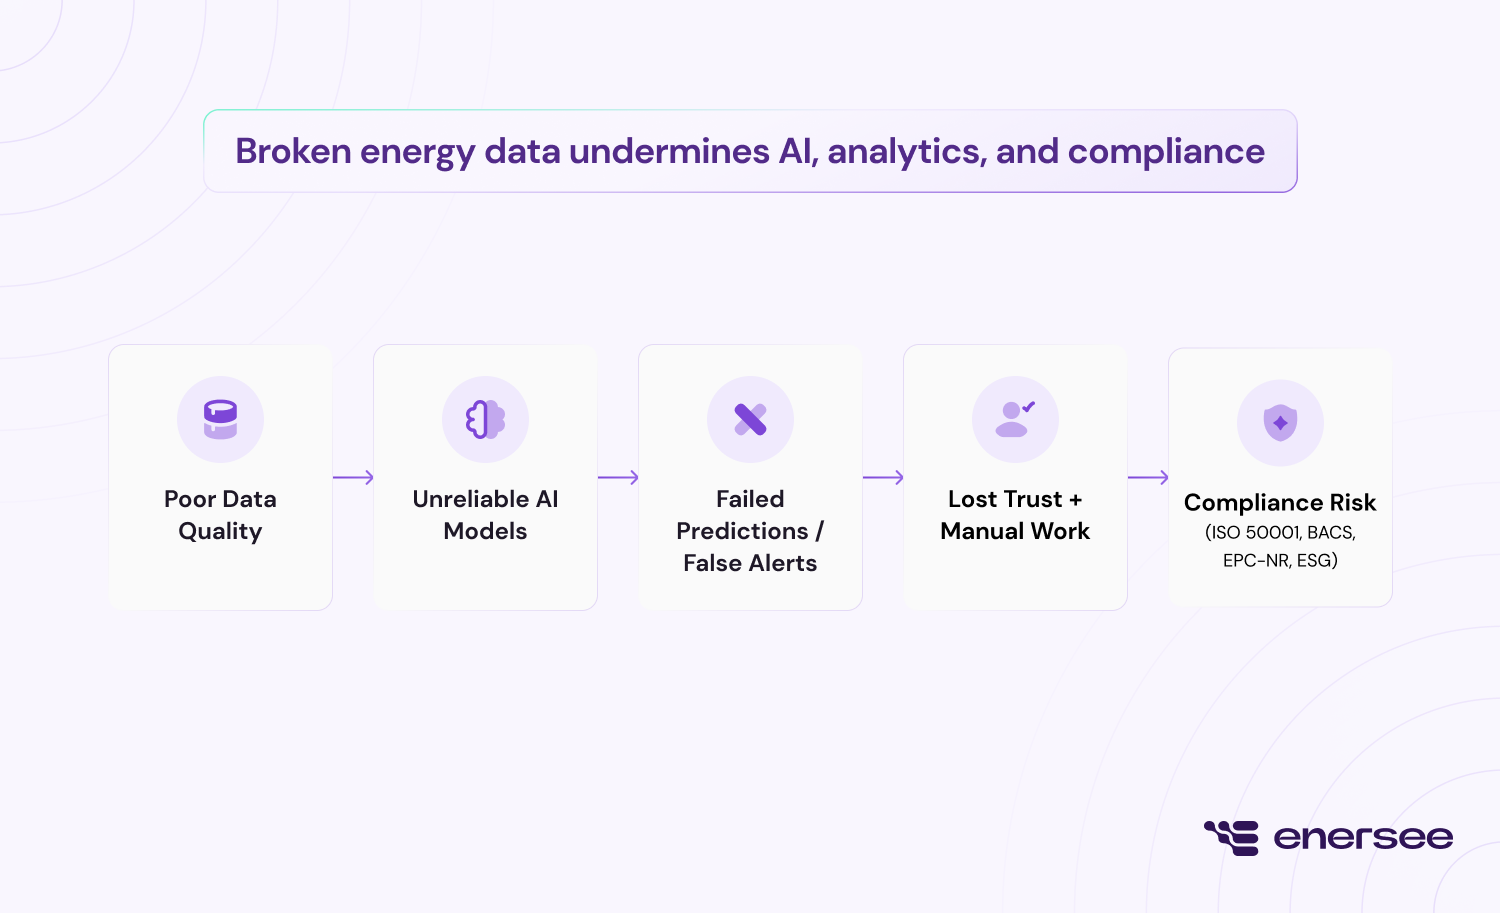
A few years ago, Gartner projected that only around 15% of AI projects would succeed, implying an 85% failure rate largely because models built on clean lab data often fail with messy real-world data.
A huge number of data and analytics leaders, 87% to be exact, believe that AI and machine learning projects failed because of poor data quality. Another 31% also point to incomplete data as the primary culprit.
The bottom line is rather easy to see. A model built on inconsistent or ungoverned energy data will lose its credibility when working under real-world conditions.
Compliance suffers for the same reasons. There are over 600 variations in sustainability reporting worldwide. Standards such as ISO 50001, BACS, EPC-NR, and ESG require traceable calculations and auditable data flows.
Without reliable lineage and governance, organizations need to fall back on manual audit and spreadsheet-based reporting, which are difficult, hard to scale, and prone to errors.
Energy data needs infrastructure, not another dashboard
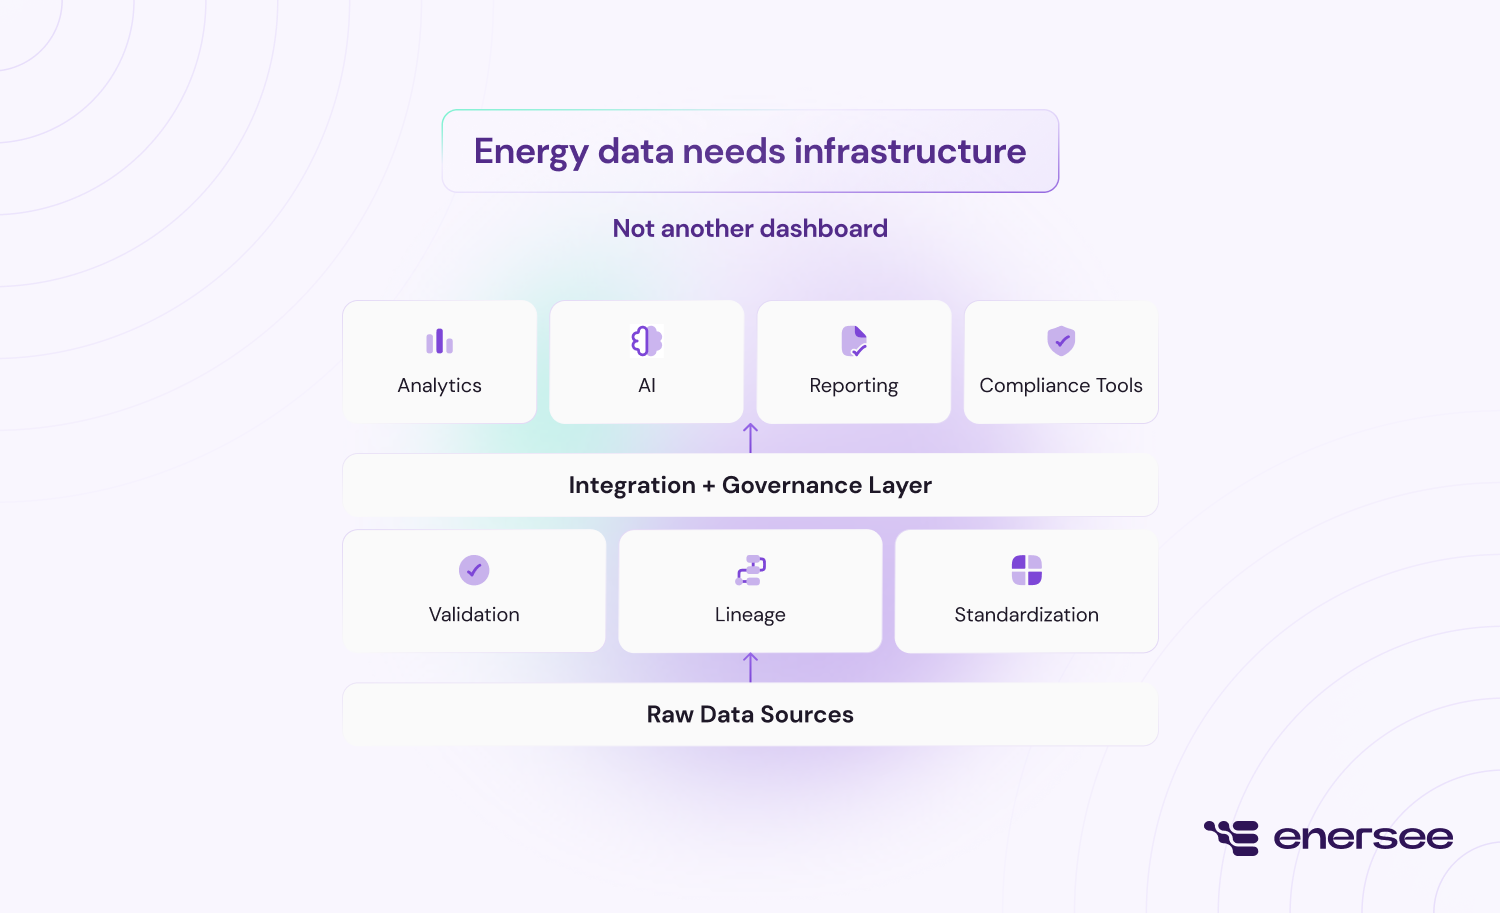
At the heart of these challenges, there’s a structural problem. Many organizations look at applications first. Dashboards, alerts, and reports all seem more important at first than the data layer underneath.
In other domains, modern data stacks separate ingestion, governance, and activation. They preserve raw data, validate its quality, and share curated datasets across tools. With energy data, that’s often not the case.
Instead, organizations add more dashboards, more alerts, in the hope of fixing something, but the result is more fragmentation. The fix could be easy.
An integration and governance layer that sits between data sources and applications, helping validate quality, track lineage, and make clear data available. This creates a single source of truth and brings much-needed transparency to the mix.
Fixing energy data is the prerequisite for cost, carbon, and compliance impact
It’s clear by now that one of the biggest problems in energy management is using data. You can’t optimize something you don’t trust, can’t scale something you can’t standardize, and you certainly can’t prove results you can’t trace.
Enersee Connect bridges the huge gap that often exists between data and energy management tools. Acting as a dedicated integration and data governance layer for energy data, Enersee Connect centralizes data from BMS, utilities, meters, and IoT sources. All of that, while making data quality, completeness, and lineage transparent by design.
The architecture handles real-world complexity by:
- Managing data gaps, jumps, and meter replacements without disruption.
- Supporting both batch and real-time ingestion.
- Preprocessing data through virtual meters, 15-minute time slicing, and conversion factors.
- Staying open and portable, with APIs that feed Enersee’s analytics platform and other applications.
Rather than replacing your existing analytics tools, this approach gives them reliable data. The focus goes from fragmented solutions to a governed data place where quality, lineage, and access controls are central. For enterprises serious about energy management, this infrastructure layer is the foundation everything else depends on.
Written by
Joachim
and