Most organizations can tell you what they invest in energy efficiency. Far fewer can prove what it actually saved.
A building gets a new HVAC system, consumption drops - but is that the measure, a mild winter, or lower occupancy? Without a verified methodology, you can't tell.
That's the gap IPMVP, the globally recognized standard for measuring, calculating, and verifying energy saving - was built to close.
In this guide, we cover what IPMVP is, how its four options work, and why Option C is the most powerful approach for continuous building energy performance tracking.
What is IPMVP?
The International Performance Measurement and Verification Protocol (IPMVP) is the globally recognized standard for quantifying energy savings from energy efficiency measures.
Developed by the Efficiency Valuation Organization (EVO) and adopted in over 40 countries, it gives energy managers, ESCOs, and financial institutions a shared framework for one question: how much energy did this projectactually save?
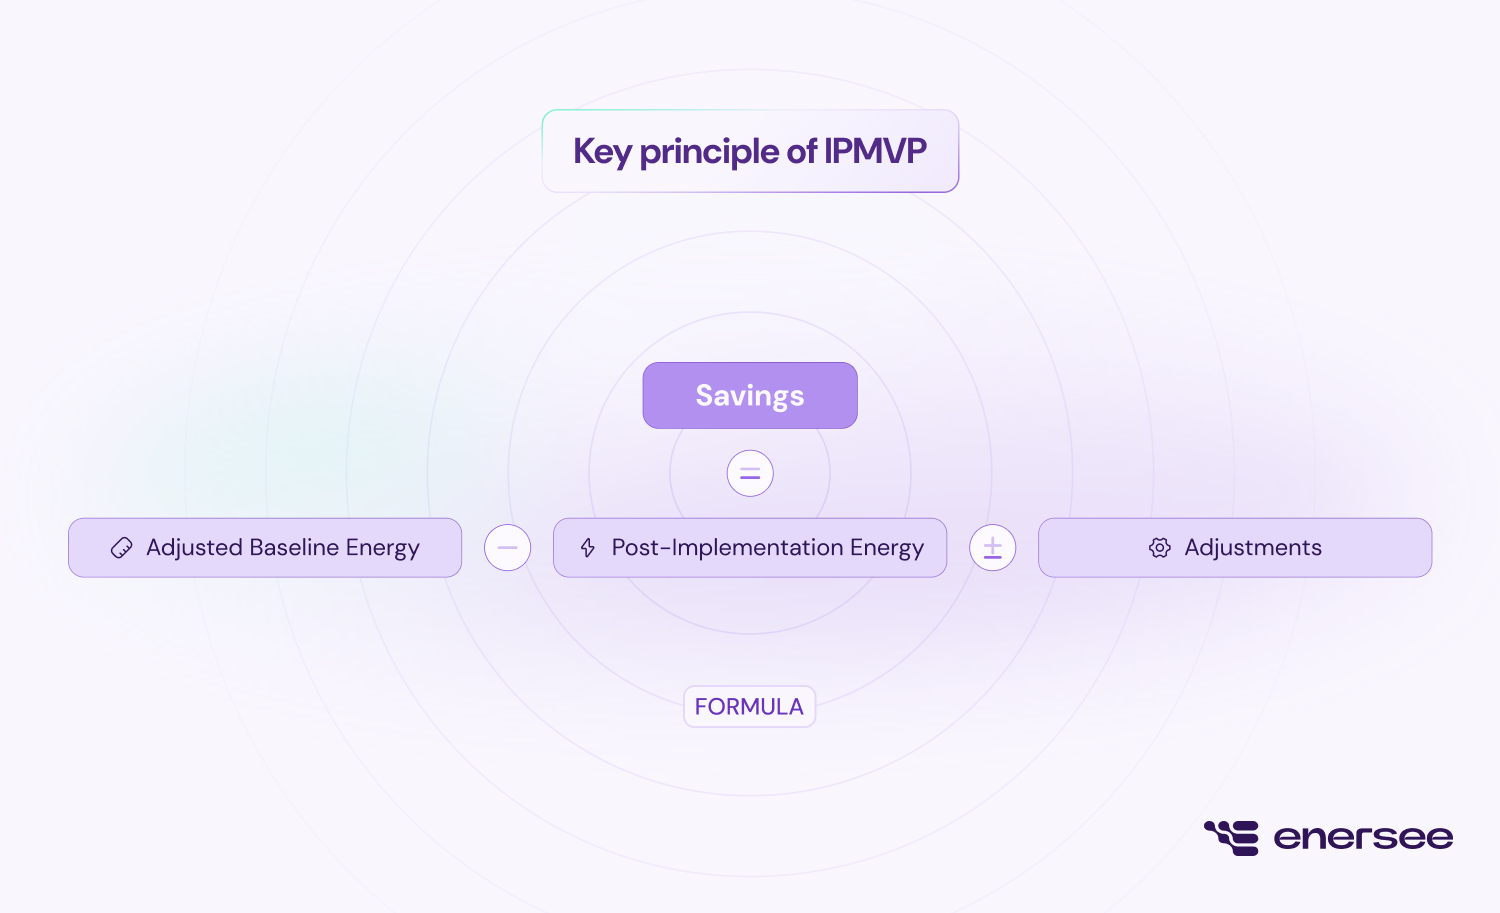
The answer is never as simple as reading a meter. Savings represent energy that was not consumed and can not be measured directly. IPMVP works by comparing actual post-implementation consumption against a modelled baseline, adjusted for current conditions.
The adjustment step is what makes it rigorous. Without it, a cold winter looks like an efficiency gain. A production ramp-up looks like a problem.
IPMVP removes that ambiguity by normalising for the variables that actually drive consumption: weather, occupancy, operating hours, production output.
Why is IPMVP the strongest protocol for energy efficiency verification?
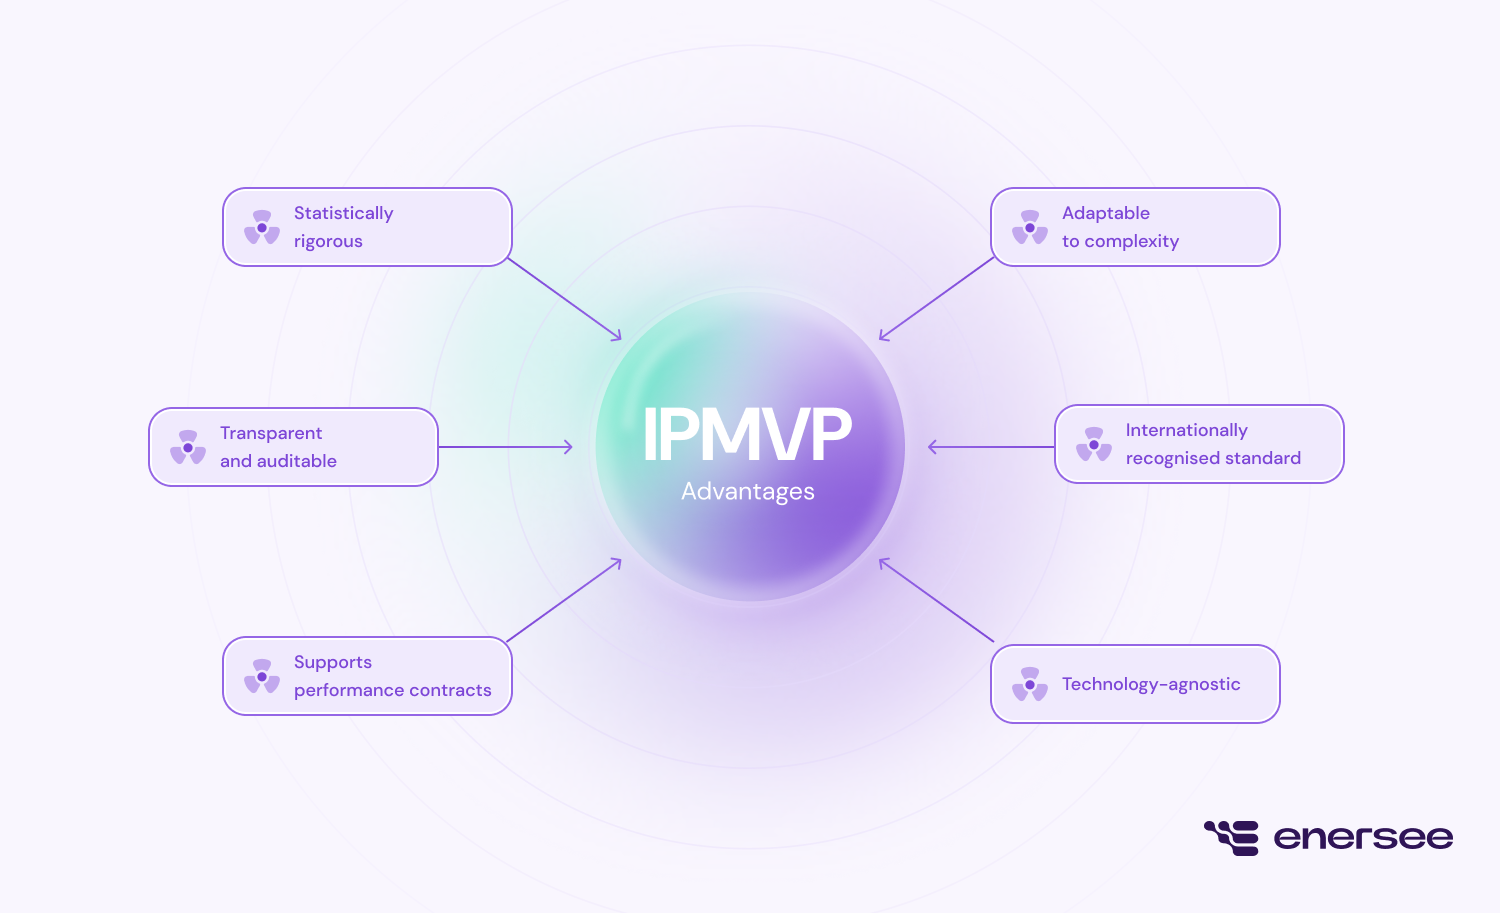
IPMVP has become the de facto standard for measurement and verification in the energy efficiency industry and for good reason.
Adopted in over 40 countries by governments, ESCOs, and financial institutions, it combines scientific rigor with enough flexibility to apply to any energy conservation measure, regardless of technology or building type.
Its regression-based baseline models, defined accuracy requirements, and uncertainty analysis mean that every result is independently verifiable. This matters enormously in high-stakes environments like performance contracts, investor reporting, and regulatory compliance.
The protocol also provides clear guidance on measurement boundaries, non-routine adjustments, and uncertainty management: factors that ad-hoc approaches to savings verification routinely overlook.
Perhaps most importantly, IPMVP is the evidentiary backbone that makes Energy Performance Contracts and Energy Service Agreements financially viable for both sides. When accountability is on the line, well-intentioned but informal savings calculations cannot substitute for that.
What are the four IPMVP options?
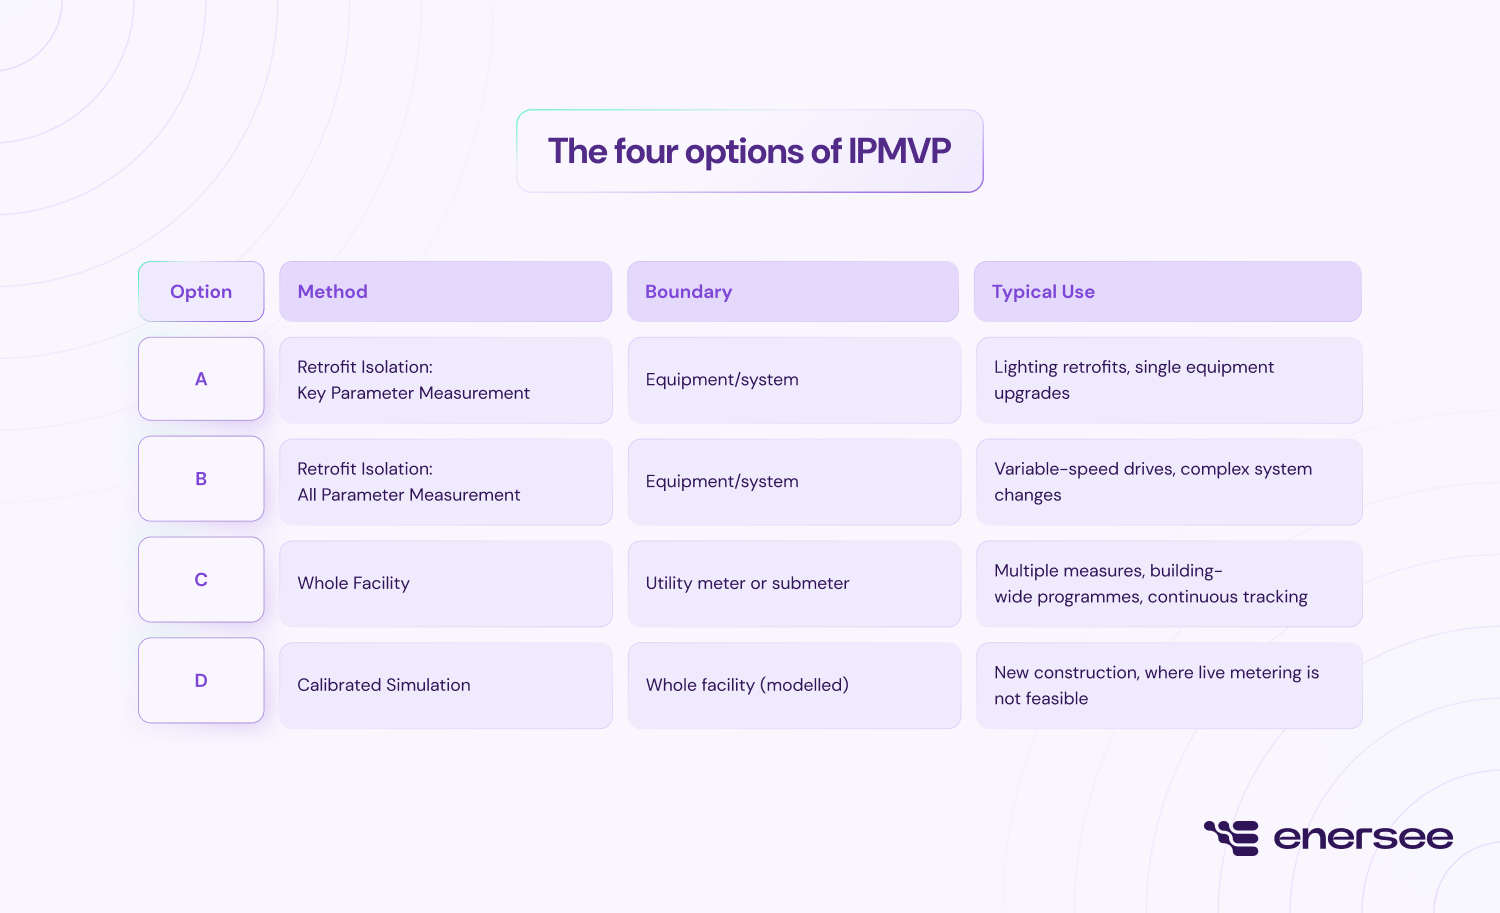
IPMVP defines four Measurement and Verification (M&V) options. The right one depends on the type of energy conservation measure (ECM), available metering infrastructure, and the accuracy required.
Options A and B work well for isolated, single-measure projects. Option D covers situations where live metering isn't available. If you run multiple measures across building portfolios and need continuous, automated energy efficiency monitoring, Option C is the right choice.
Why does Option C work best at portfolio scale?
Option C uses whole-facility or sub-facility meter data to assess energy performance. Rather than isolating individual pieces of equipment, it captures the net effect of all measures at the meter. This makes it uniquely suited to continuous, portfolio-scale performance tracking.
Its flexibility is one of its biggest practical strengths. Applied to a main utility meter, Option C captures the combined impact of every measure in a facility. Applied to a submeter, such as an HVAC circuit, a lighting installation, or a compressed air system, it isolates the performance of a specific intervention with statistical precision.
Most organisations don't implement one measure at a time. They upgrade lighting, optimise controls, and improve insulation within the same project cycle. Option C handles both levels: the real-world net result at the facility level, and granular attribution at the system level.
Because the methodology relies entirely on metered data rather than physical measurements, it can be fully automated. A platform can ingest meter data, build regression models, run routine adjustments, and report savings continuously — with no manual intervention required. That's not a minor operational detail. It's what makes Option C viable at scale.
How does the process work?
- Baseline period: A representative period of metered data, typically 12 months, is selected to cover all seasonal and operational variation.
- Baseline model: A regression model is fitted to the baseline data, capturing how consumption responds to key variables: heating and cooling degree days, production volumes, occupancy, operating schedules.
- Post-implementation measurement: After the ECM is installed, actual consumption continues to be metered at the same boundary.
- Baseline adjustment: The model predicts what consumption would have been under current conditions.
- Savings calculation: The difference between the adjusted baseline and actual post-implementation consumption is the verified saving.
How do you ensure savings calculations under Option C are defensible?
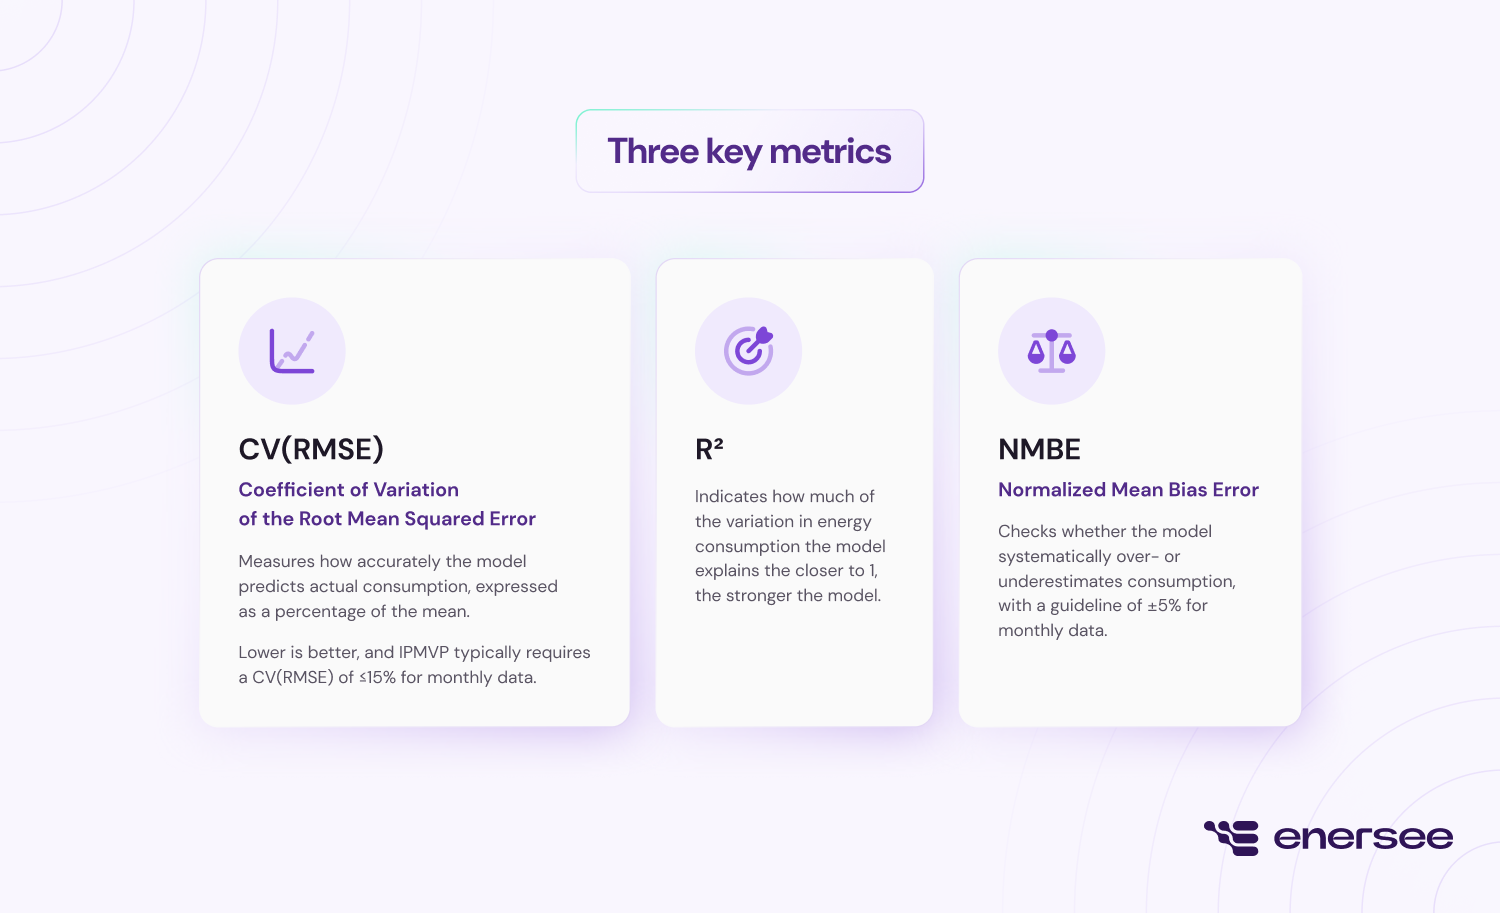
Running Option C isn't enough on its own. The model behind it needs to be statistically valid, and IPMVP sets clear standards for exactly that. Three metrics are used to evaluate model quality:
- CV(RMSE), or the Coefficient of Variation of the Root Mean Squared Error, reflects how closely the model's predictions align with actual consumption values. IPMVP generally requires this to be ≤15% for monthly data.
- R² captures the share of variability in energy consumption that the model accounts for, with values nearer to 1 indicating a more reliable fit.
- NMBE, the Normalized Mean Bias Error, reveals whether the model tends to consistently over- or underestimate consumption, with accepted deviation kept within ±5% for monthly data.
Together, these three metrics determine whether a model is fit for purpose, technically sound, and legally and financially defensible.
Why high-frequency metering changes the precision picture
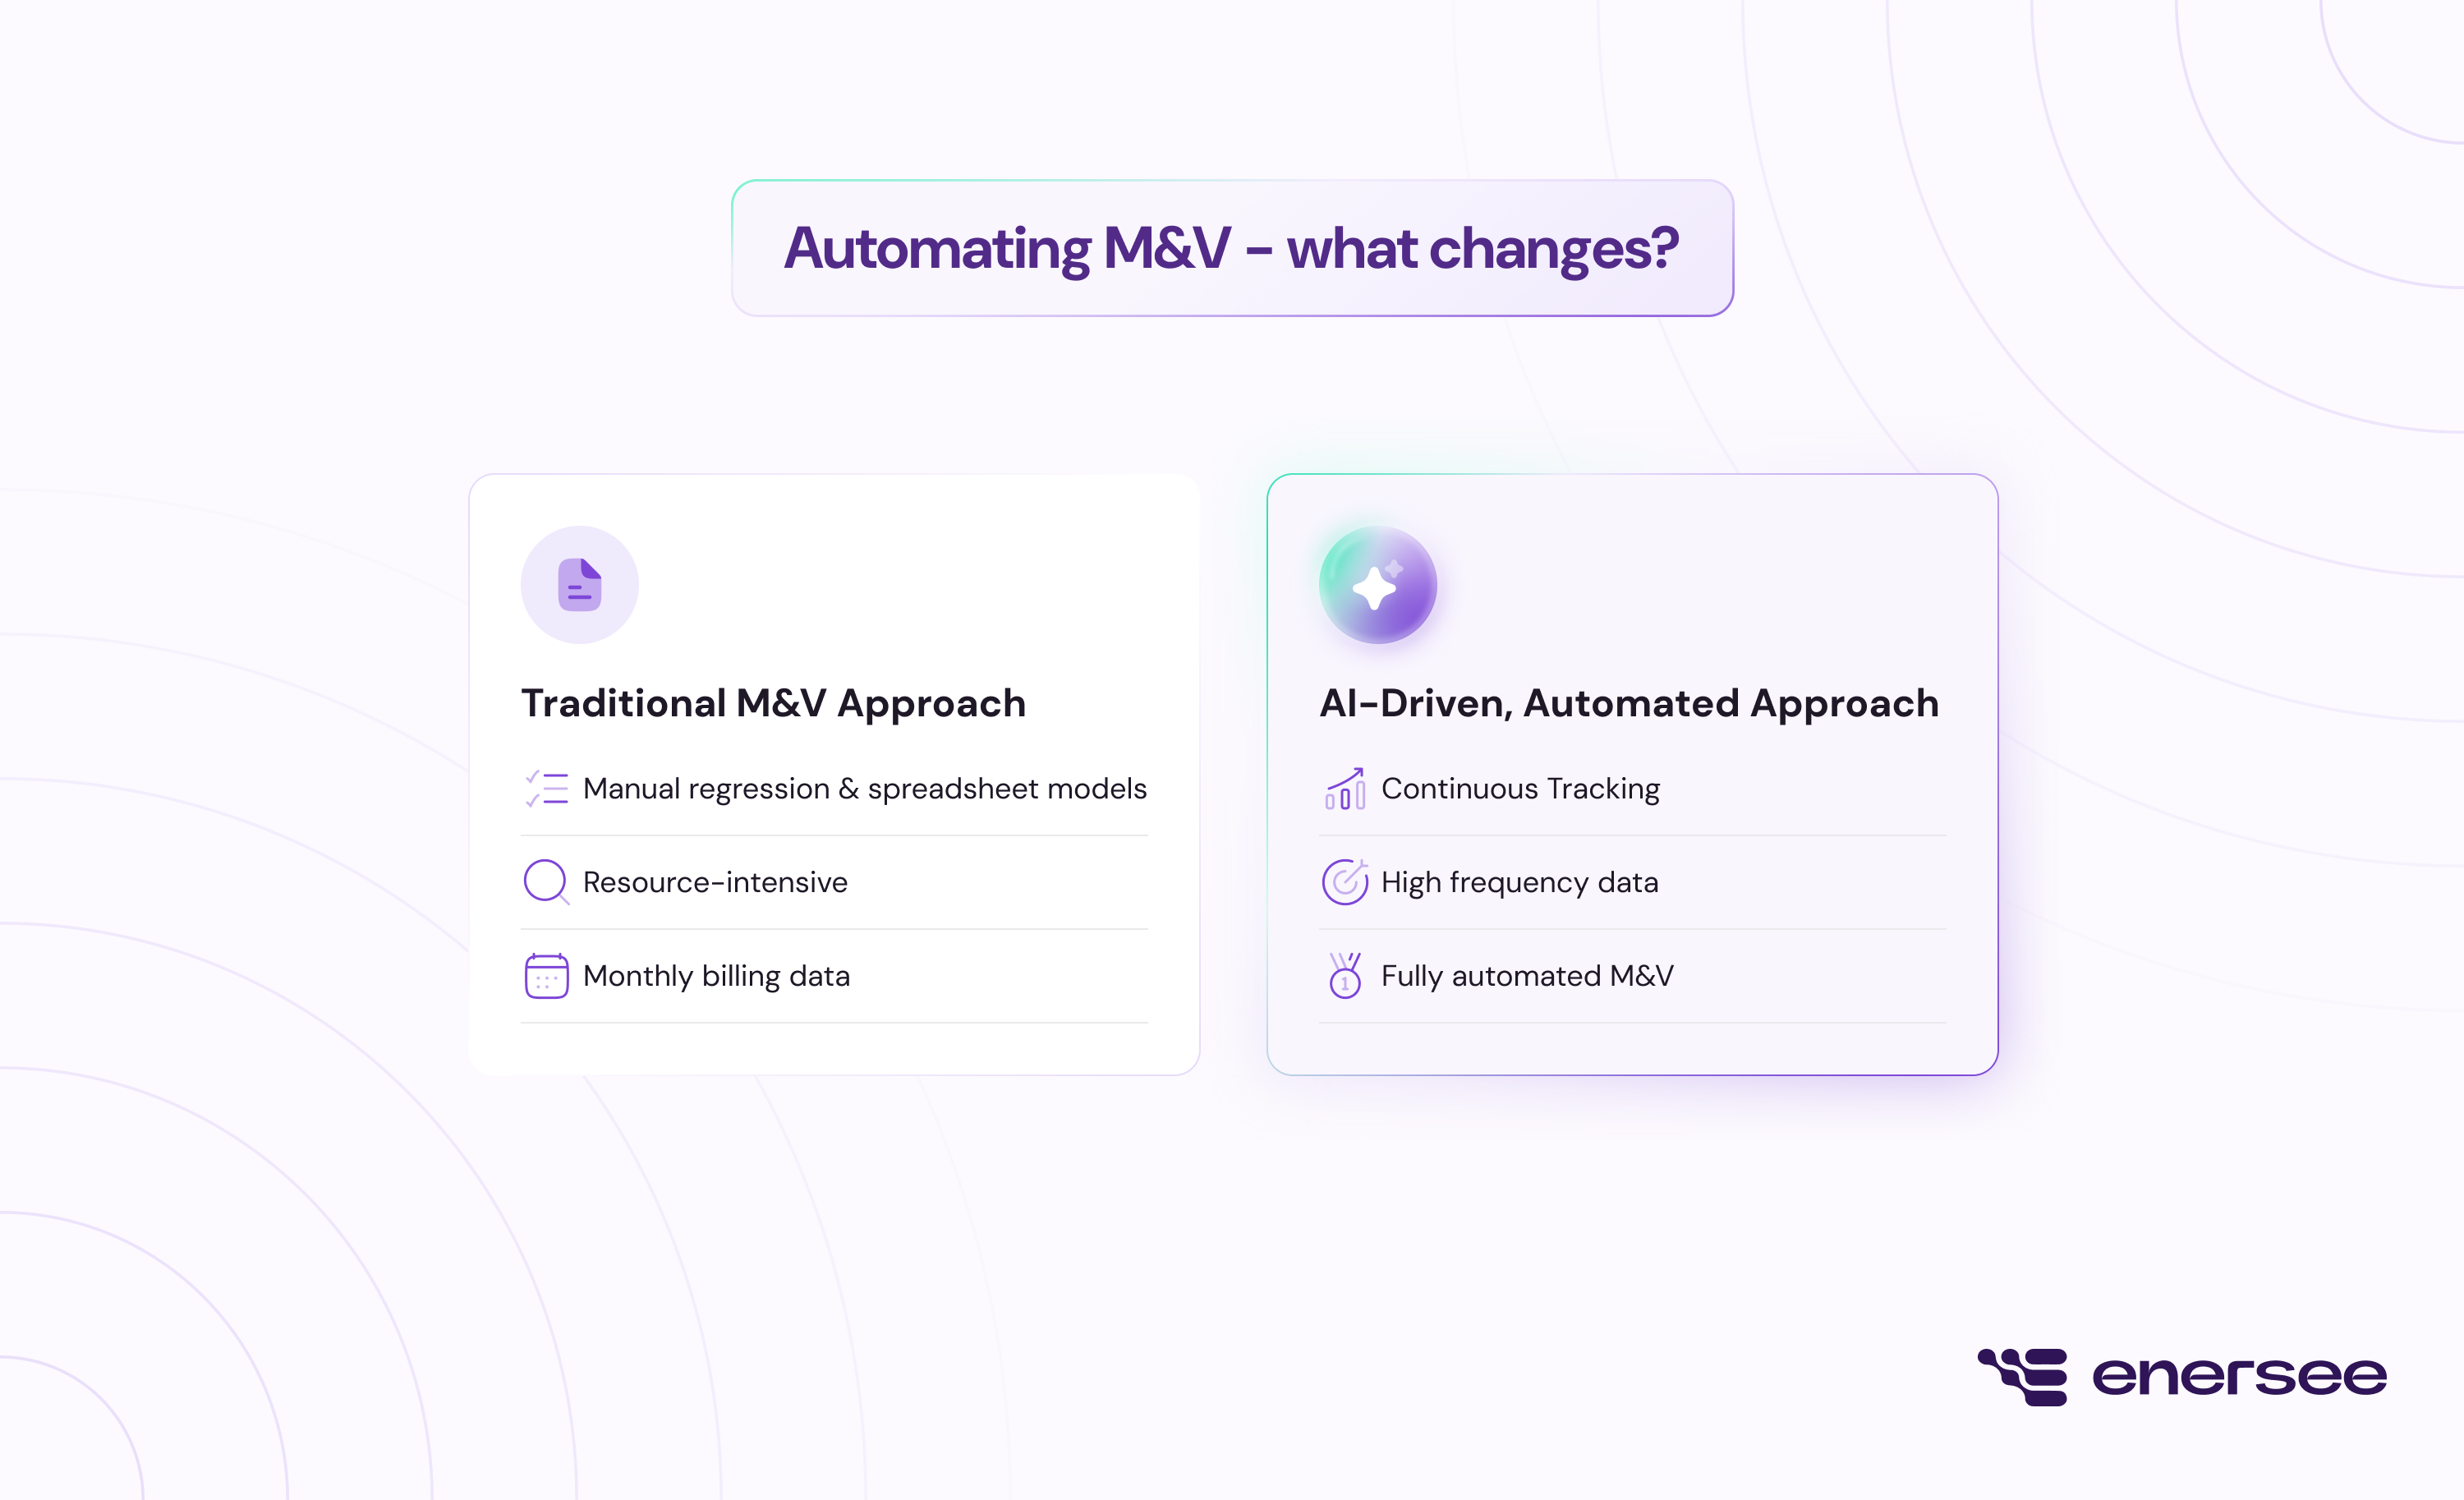
Traditional M&V approaches rely on monthly utility billing data. With only 12 data points per year, baseline models are coarse, deviations are slow to emerge, and verification typically requires 6 to 12 months of post-implementation data before results carry any statistical weight.
High-frequency metering, interval data at hourly resolution, changes that entirely. With hundreds of data points per meter per month, models are sharper and deviations become statistically detectable within days of an ECM going live. This is especially important in the early stages after implementation, when stakeholders need rapid confirmation that the measure is performing as expected.
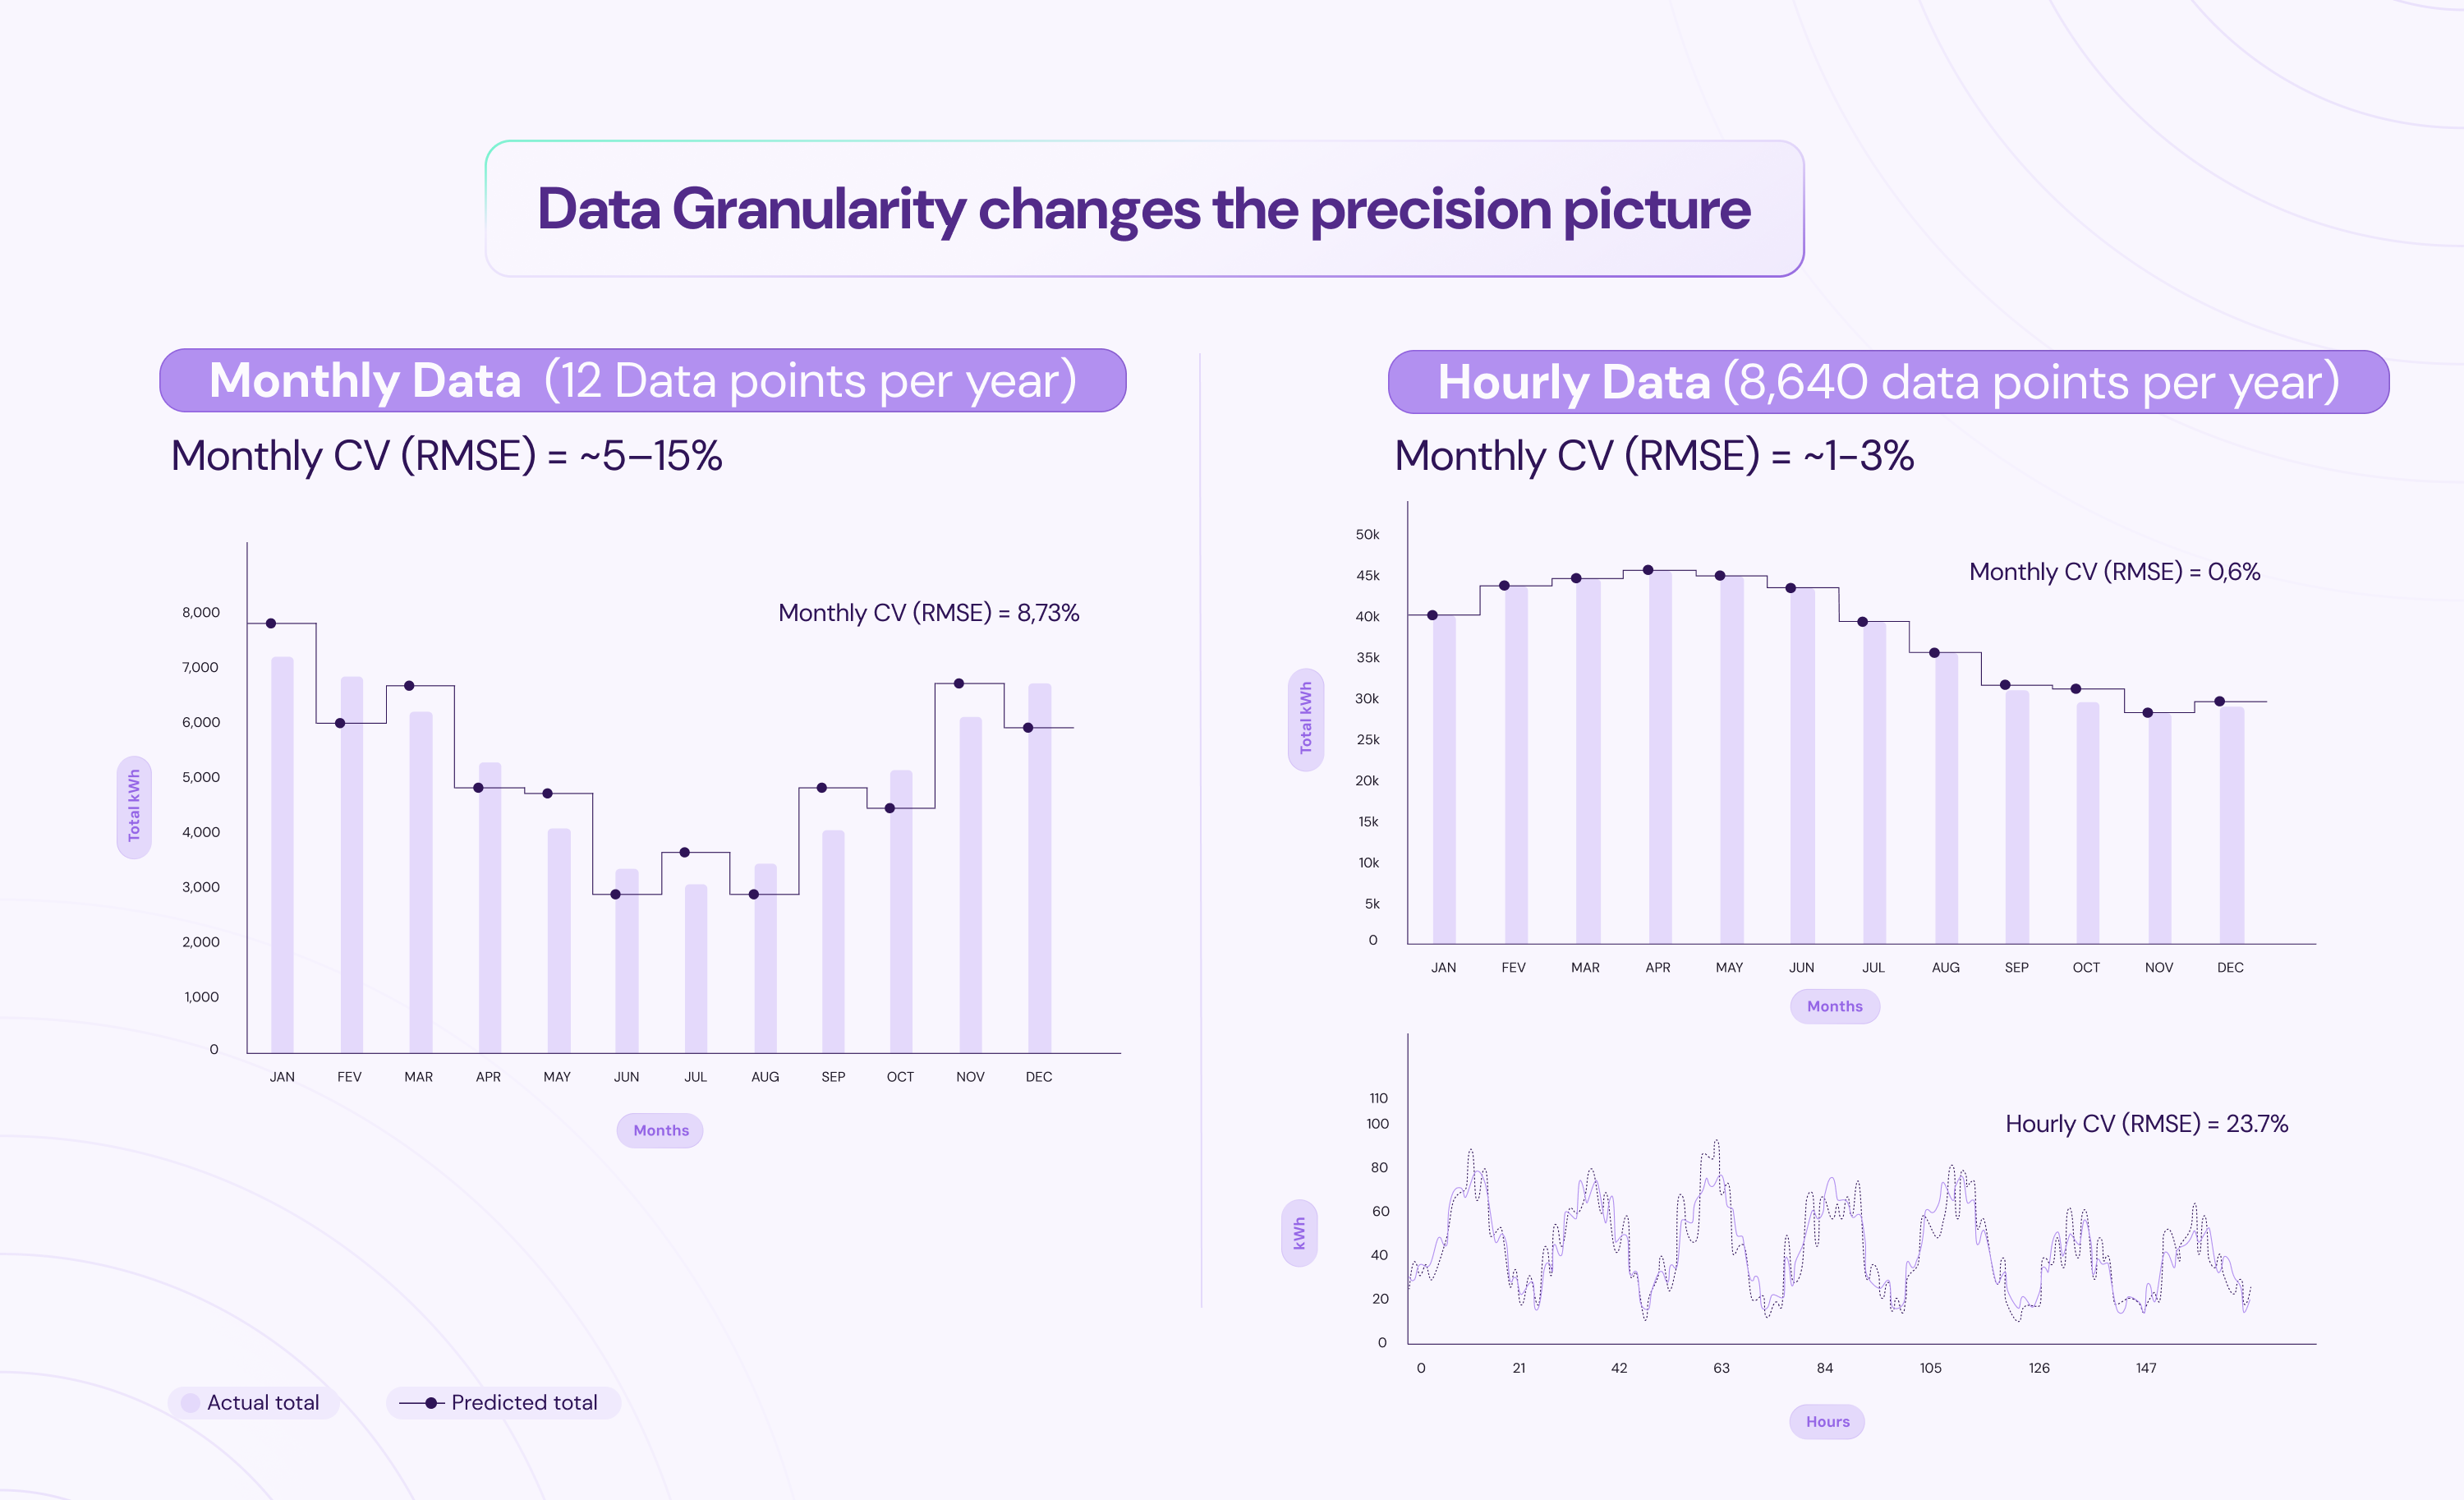
The precision improvement is also significant. A model built on hourly interval data typically achieves a CV(RMSE) of around 15% at the interval level. But when errors are aggregated over time, they partly cancel out. The formula is:
CV(RMSE)_monthly ≈ CV(RMSE)_interval / √N
Where N is the number of intervals in the aggregation period. With approximately 720 hourly intervals per month:
- √720 ≈ 26.8
- Monthly CV(RMSE) ≈ 15% ÷ 26.8≈ 0.6%
The same model that operates at 15% accuracy per interval delivers monthly savings verification at 0.6% precision. In other words, a model that meets IPMVP thresholds on hourly data is orders of magnitude more precise when evaluated at the monthly level than any model built directly on monthly billing data.
The impact of an energy efficiency measure becomes demonstrable far earlier and far more reliably. For real-time energy monitoring across large portfolios, that is the difference between reactive reporting and genuine performance intelligence.
Enersee - Automated M&V, built for scale
Enersee brings the full rigour of IPMVP Option C into a fully automated, scalable energy monitoring platform without the manual regression work, spreadsheet models, or periodic consultant reviews that make traditional M&V slow and expensive.
1. Fully Automated M&V
Enersee automates the entire Option C workflow: from data ingestion and baseline model building via AI to savings reporting. There is no need for manual regression analysis, spreadsheet-based calculations, or periodic consultant reviews. The platform continuously processes incoming meter data and updates savings calculations in real time.
2. Applied on Main Meters and Submeters
The platform is designed to work at any metering level. Whether the data comes from a building’s main utility meter or from submeters dedicated to specific systems (HVAC, lighting, production lines, compressed air, etc.), enersee applies the same IPMVP Option C methodology consistently. This means organisations can track both the overall facility performance and the contribution of individual measures simultaneously.
3. High-Frequency Data for Immediate Detection
One of Enersee’s defining characteristics is its focus on high-frequency meter data, typically at 15-minute or hourly intervals. This granularity provides two decisive advantages:
- More accurate baseline models. With thousands of data points per meter, the AI-models capture consumption patterns with far greater fidelity than monthly billing data ever could.
- Day-one performance detection. Because the models are built on high-resolution data, deviations from the expected consumption become statistically detectable within days of an ECM’s implementation — not weeks or months. This allows stakeholders to confirm that a measure is performing as intended from the very first day after installation.
Traditional M&V approaches based on monthly billing data require 6–12 months of post-implementation data before savings can be confirmed with confidence. Enersee’s high-frequency approach compresses this timeline dramatically, enabling performance confirmation from day one.
4. Continuous Tracking and Alerting
Beyond initial verification, enersee provides ongoing performance tracking. If the savings from an energy conservation measure start to degrade over time — due to equipment drift, behavioural changes, or maintenance issues — the platform detects the deviation and can alert stakeholders. This transforms M&V from a one-time exercise into a continuous assurance mechanism.
5. Bridging the Gap
By automating IPMVP Option C and applying it to both main meters and submeters with high-frequency data, enersee bridges the gap between the rigour of an internationally recognised M&V protocol and the practical reality of day-to-day energy management. It makes performance-based tracking accessible, immediate, and scalable - whether for a single building or an entire portfolio.
Written by
Joachim
and